
Observational Study
 Change in the Adiponectin and Metabolic Parameters After MetforminTreatment in Patients with Type 2 Diabetes Mellitus
Abstract
Aim: To study the effect of metformin treatment on adiponectin levels and other parameters in newly diagnosedpatients with type 2 diabetes mellitus
Methods: This is a prospective observational study in a single centre where 46 patients with type 2 diabetes mellitusare included. Metformin is given to achieve the glucose control for 6 months and adiponectin levels are estimated atbaseline and after 6 months of metformin treatment. The primary endpoint is to study the change in the adiponectinlevels with metformin and secondary endpoint being the change in the body mass index (BMI), fasting blood glucose(FBG), postprandial blood glucose (PPBG), haemoglobin A1c (HbA1c), lipid profile.
Results: BMI is reduced by 1 kg/m2 (p<0.0001), FBG and PPBG decreased from 155.2±27 mg/dL, 269±76.6 mg/dLat baseline to 102±16.7 mg/dL, 160±13.9 mg/dL after treatment (p<0.0001). HbA1c has decreased from 7.1±0.7%to 6.2±0.5% which is statistically significant (p=0.0001). In our study, total cholesterol (TC) and triglycerides (TGs)has decreased from 203±3.5 mg/dL, 199.0 mg/dL from baseline to 189±33.0 mg/dL, 166±34.6 mg/dL after 6 monthsof metformin treatment respectively which is statistically significant (p=0.0001). LDL has decreased from 95.1±21.3mg/dL to 94.0±17.8 mg/dL, but statistically not significant (p=0.359). The levels of high-density lipoproteins (HDL)have decreased from 39.1±4.7 mg/dL to 38.4±4.6 mg/dL which is also statistically not significant (p=0.240). There isa significant increase in serum adiponectin level from 28.7±12.6 µg/mL at baseline to 36.4±12.5 µg/mL after 6 monthsof metformin treatment (p=0.0001). There is no correlation between adiponectin and BMI, BMI, FBG, PPBG, HbA1cand lipid profile. Mild gastrointestinal (GI) symptoms are seen in 4 patients. No patient reported hypoglycaemia
Conclusion: In conclusion, our study has shown the beneficial effect of metformin treatment on BMI, glycaemic control andimprovement in the lipid parameters. There is a significant elevation of adiponectin with metformin treatment but there is nocorrelation between adiponectin and the above parameters suggesting that these effects are through different mechanisms.
Keywords
Type 2 diabetes mellitus, metformin, BMI, adiponectin
Introduction
Type 2 diabetes mellitus (T2D) is characterized by insulin resistance and relative insulin deficiency. Adiponectin is secretedfrom the adipose tissue and implicated in insulin resistance and morbid obesity is associated with low levels of adiponectin.1-7Adiponectin secretion from subcutaneous adipose tissue (SAT) and visceral adipose tissue (VAT) is also different.8 Metforminis the first-line drug in the treatment of T2D. A lot of mechanisms are proposed as the actions of metformin includingactivating mitogen-activated protein kinase (MAPK) pathway and the resultant reduction in the gluconeogenesis in the liver.It’s also proposed that metformin also acts through increasing adiponectin levels and consequent improvement in insulinsensitivity.9 But the relation between metformin action and adiponectin levels is controversial as reported in the literature.10,11So, we wanted to study the effect of metformin treatment on adiponectin levels and other parameters in newly diagnosedpatients with T2D.
The incidence of MI rises with atherosclerotic disease mainly predisposed by six primary risk factors viz. diabetesmellitus (DM), hypertension, tobacco use, dyslipidaemia, male sex and family history of arterial atherosclerosis.4 Occurrenceof myocardial ischaemia characterised mainly by cell death, takes variable duration depending upon the presence of collateralsto the ischaemic zone, persistent or intermittent coronary arterial occlusion, the myocytic sensitivity to ischaemia, preconditioning or finally, individual demand for myocardial oxygen and nutrients.
From a morphological viewpoint, the two types of MI are transmural and non-transmural, whereas on the basis ofelectrocardiographic findings are ST-elevation myocardial infarction (STEMI) or non-ST-elevation myocardial infarction(NSTEMI).5 Diagnosis is confirmed by ECG, serum cardiac biomarkers, cardiac imaging, and nonspecific indices of tissuenecrosis and inflammation. If untreated, the ischemia worsens manifesting as reduced ventricular compliance (diastolic failure)and/or a reduced stroke volume with secondary cardiac dilation (systolic failure) producing cardiogenic shock (hypotensionrefractory to volume resuscitation with features of end-organ hypoperfusion due to myocardial damage) and heart failure viz.chronic progressive condition where heart falls unable to pump blood enough to meet bodily demands.6-8 Additionally, MIcauses the ventricular wall or papillary muscle rupture leading to mitral regurgitation or pseudoaneurysms.9 Arrhythmias viz.change from the normal sequence of electrical impulses e.g., ventricular flutter and fibrillation and sudden cardiac death areother noted complications.10,11
Patients and Methods
This is a prospective observational study done in the Department of Endocrinology, King George Hospital, Visakhapatnam,Andhra Pradesh, India from September 2018 to July 2019. Sixty-eight newly detected patients with type 2 diabetes mellitusand prediabetes attending the endocrinology OPD are included in the study. The American Diabetic Association (ADA)criteria are taken to define diabetes mellitus and prediabetes (diabetes mellitus when fasting plasma glucose is ≥126 mg/dL orpost glucose plasma glucose ≥200 mg/dL, prediabetes when fasting plasma glucose is 100-125 mg/dL or post glucose plasmaglucose 140-199 mg/dL). Patients who are controlled on diet and lifestyle measures are excluded from the study. Also, patientswho required oral antihyperglycemic drugs (OAD) other than metformin and insulin are excluded. FBG, 2hr PPBG, HbA1cserum creatinine and lipid profile are estimated at baseline. These patients are started on metformin 1000 mg/day and doseadjusted to target diabetes control. The mean dose of metformin used is 740±350 mg/day (range 500-1500). Adiponectin levelsare estimated at baseline and 6months after treatment. Adiponectin is measured by using RD191023100 human adiponectinenzyme-linked immunosorbent assay (ELISA), high sensitivity sandwich enzyme immunoassay (Biovender R&D products,Czech Republic). The lowest detectable range of adiponectin is 5 µg/mL.
Statistical analysis is done using SPSS software version 16. Pearson correlation analysis is used to determine the strength ofassociation between parameters. R-value of 0.8 to 1.0 is considered significant.
Results
Out of a total of 64 patients, 10 patients required other OADs and insulin, whereas 5 controlled on only lifestyle measures andmedical nutrition therapy. Three patients didn’t turn up for the follow-up. So, the final analysis is done in 46 patients with type2 diabetes mellitus. Baseline characteristics are depicted in.
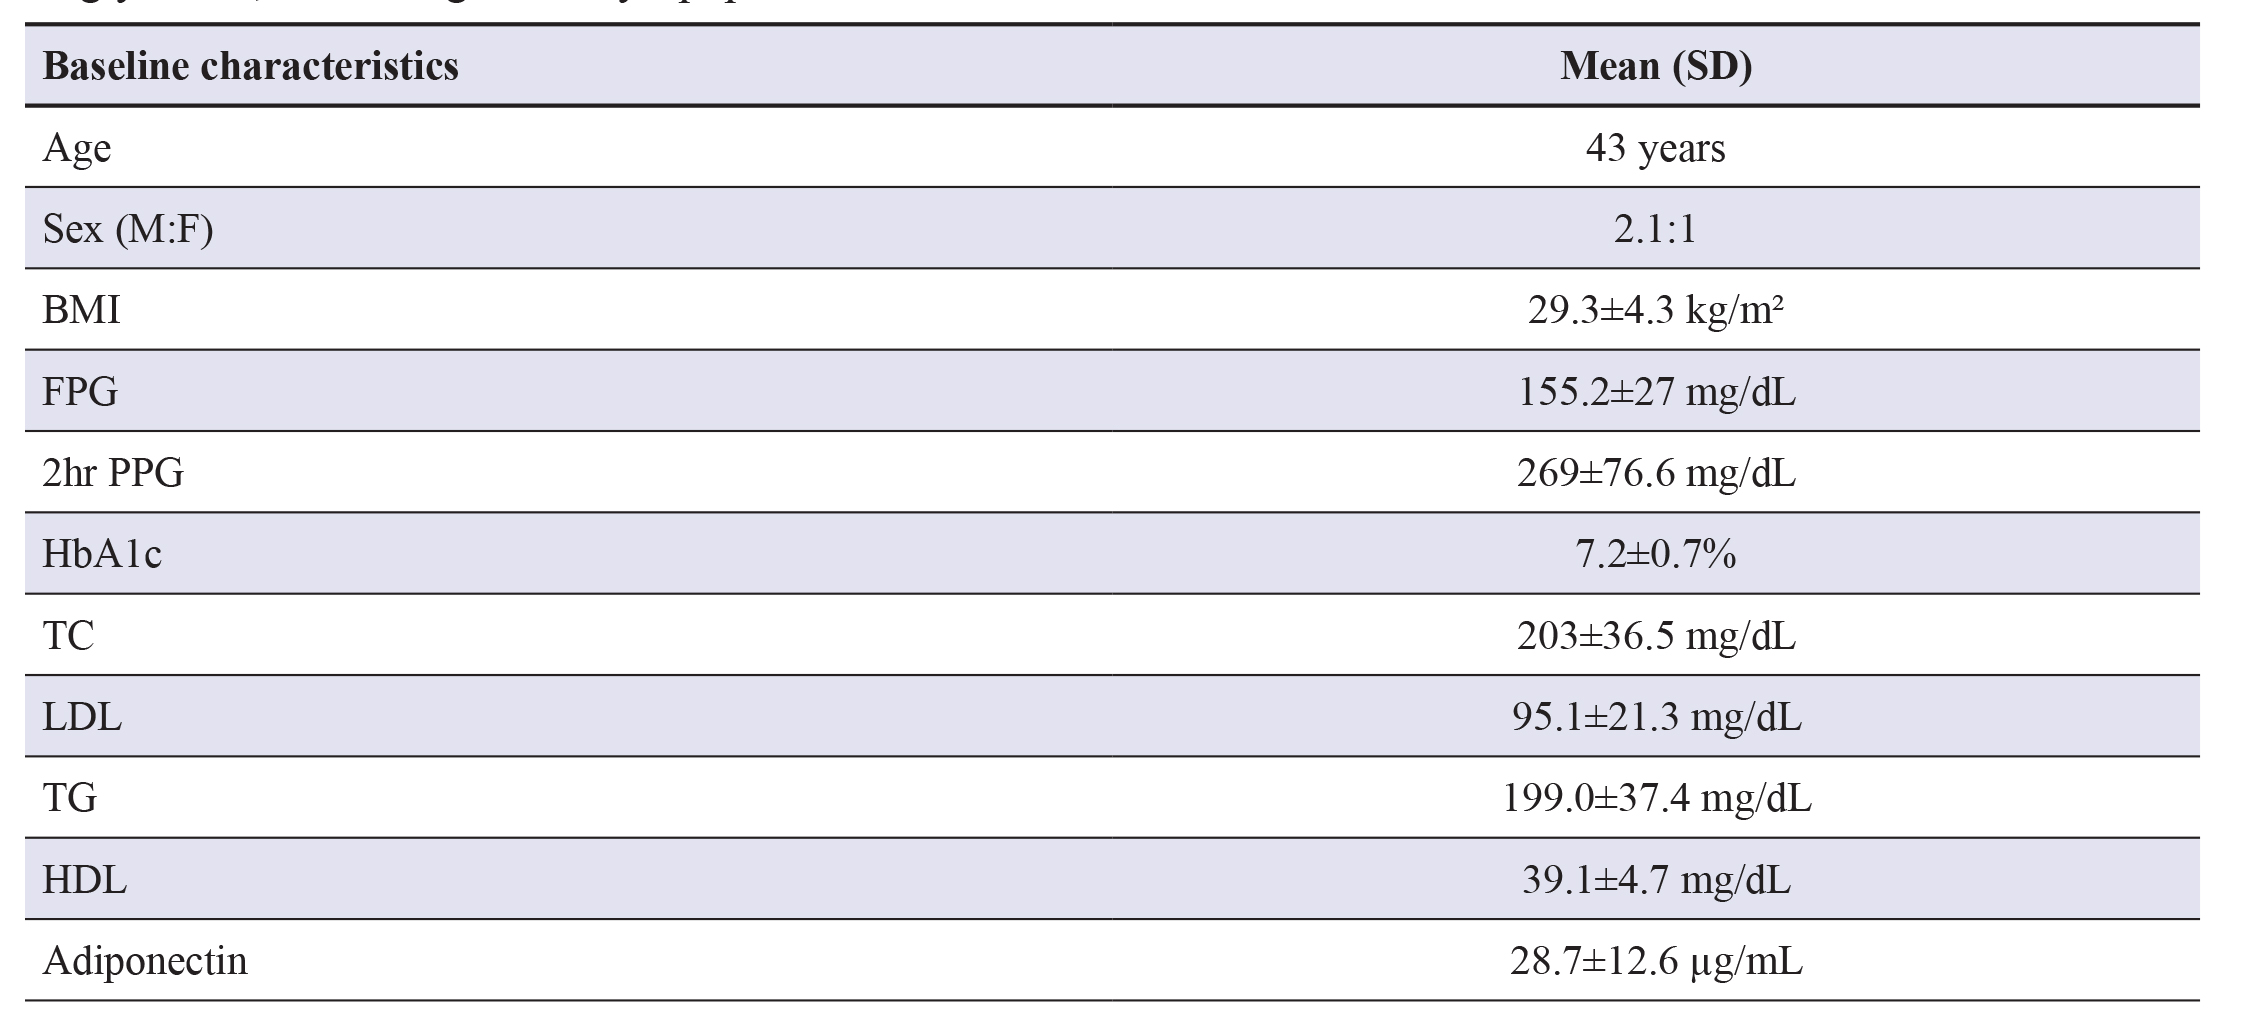
Table 1 The mean age of the patients is 43 years in our study andthe maximum number are between 40 to 60 years. Males are more than females in our study. The mean FPG is 155.2±27 mg/dL and 2hr PPG is 269±76.6 mg/dL with HbA1c of 7.2±0.7%. Baseline lipid parameters include total cholesterol (203±3.5mg/dL,) low-density lipoproteins (LDL) cholesterol (95.1±21.3 mg/dL), triglycerides (199±37.4 mg/dL) and mean HDL(39.1±4.7 mg/dL). The mean adiponectin in our study is 28.7±12.6 µg/mL.
Table 1. Baseline characteristics. Abbreviations: BMI- Body mass index; FPG- Fasting plasma glucose; PPG- Postprandial plasma glucose; HbA1c- Haemoglobin A1c; TC- Total cholesterol; LDL- Low-density lipoprotein; TGTriglyceride; HDL- High-density lipoprotein.
After metformin treatment:The results are depicted in
Table 2 6 months after metformin treatment, BMI has significantly decreased from 29.3±4.3 kg/m2 to 28.3±3.9 kg/m2. FBG andPPBG decreased from 155.2±27 mg/dL, 269±76.6 mg/dL at baseline to 102±16.7 mg/L, 160±13.9 mg/dL after treatment bothare statistically significant (p<0.0001). HbA1c has decreased from 7.1±0.7% to 6.2±0.5% which is statistically significant(p<0.0001). In our study, TC and TG has decreased from 6.2±0.5% mg/dL, 199.0 mg/dL from baseline to 189±33.0 mg/dL,166±34.6 mg/dL after 6 months of metformin treatment respectively which is statistically significant (p=0.0001). LDL hasdecreased from 95.1±21.3 mg/dL to 94.0±17.8 mg/dL, but statistically not significant (p=0.359). The levels of HDL havedecreased from 39.1±4.7 mg/dL to 38.4±4.6 mg/dL which is also statistically not significant (p=0.240). There is a significantincrease in serum adiponectin level from 28.9±12.4 µg/mL at baseline to 36.4±12.5 µg/mL after 6 months of metformintreatment (p<0.0001). There is no correlation between adiponectin and BMI, FBG, PPBG, HbA1c and lipid profile. Fourpatients had mild GI symptoms and none had hypoglycaemia.
Table 2. Changes in parameters with treatment. Abbreviations: BMI- Body mass index; FPG- Fasting plasmaglucose; PPBG- Postprandial blood glucose; HbA1c- Haemoglobin A1c; TC- Total cholesterol; LDL- Low-densitylipoprotein; TG- Triglyceride; HDL- High-density lipoprotein.
Discussion
This is a single centre prospective observational study from a tertiary care hospital from South India. Most of the patients arein the age group of 40 to 60 years which confirms with the known fact that the incidence of diabetes mellitus increases withage. Around 40% are obese and 14% are overweight in our group which predisposes to T2D. The mean adiponectin levels are28.7±12.6 µg/mL. The mean dose of metformin used in our patients is 740±350 mg/day (range 500-1500). BMI decreasedby 0.7% (29.3±4.3 to 28.6±3.9 kg/m 2). In most of the studies, it was shown that metformin is weight neutral. The weightreduction in our study could be influenced by both lifestyle intervention and dietary modification. In some of the studies, itwas shown that metformin itself can reduce weight. The proposed mechanisms are by reducing the appetite, by increasingthe utilization of more glucose in the GI epithelial cells and also through increasing the glucagon-like peptide 1 (GLP-1)secretion. There is a significant reduction in both fasting and postprandial blood glucose. HbA1c is reduced by 0.9% (7.1-6.2%) with metformin treatment which is observed in other studies also. In our study, there is a favourable effect of metforminon the lipid profile. There is a reduction in both total cholesterol and triglycerides after metformin treatment though we cannotexclude the effect of lifestyle intervention and glucose-lowering on lipids.
The primary objective of our study is to look for the effect of metformin on serum adiponectin levels. There is a significantimprovement in adiponectin levels with metformin (28.7±12.6 to 36.4±12.5 µg/mL). In a meta-analysis by Su et al., Similarimprovement with metformin was observed.12 In another study by Zulian A et al., metformin treatment resulted in an increasein the expression and secretion of adiponectin in SAT but not in VAT in vitro.13 They also observed increase in adiponectin andreduction in the macrophage activation marker i.e., cluster of differentiation 68 (CD68) only in SAT and not in VAT even in the in vivo experiment suggesting that metformin alters adiponectin by modifying the adipose tissue inflammation. Whethermetformin directly acts over the adipose tissue through MAP kinase pathway or alters adipogenes and increases the adiponectinor is it the surrogate effect of appetite and glucose reduction or effect of altered lipolysis and lipogenesis is not known.
There is no correlation between BMI and adiponectin in our study though there are weight reduction and increase in theadiponectin levels observed, in our patients six months after metformin therapy. BMI assesses both visceral and subcutaneousadipose tissue whereas the contribution of these two portions of fat tissue to the serum adiponectin levels is controversial.Kovacova Z et al.. studied the effect of obesity on adiponectin and found that the secretion of total adiponectin is less in theadipose tissue explants from subcutaneous adipose tissue (SAT) and not in visceral adipose tissue (VAT) in obese individuals.14Nonobese people secreted more amount of high molecular weight (HMW) adiponectin from VAT, whereas this difference isnot seen in obese people. So, various monomers of adiponectin may be more relevant in obese and nonobese individuals. Afterbariatric surgery-induced weight loss, it was found that HMW adiponectin levels increased with weight loss.15 So, differentmonomeric forms estimation may be more appropriate than measuring total adiponectin levels. In our study, glucose-loweringis not associated with an increase in adiponectin levels. Blood glucose control by metformin is by reducing the gluconeogenesisfrom the liver whereas increment in adiponectin maybe by the independent action of metformin on adipose tissue and thatwill explain the noncorrelation between glycaemic control and increment in the adiponectin. Mercedes et al. showed thatadiponectin alters insulin sensitivity and low adiponectin levels are associated with reduced fatty acid oxidation in the muscleincreasing the insulin resistance.16 It was also explained that metformin improves insulin sensitivity and adiponectin may be amarker of insulin sensitivity. But there can be other reasons for the change in the adiponectin values like the role of exercise,inflammation, the ratio of subcutaneous to visceral adiposity. Our study didn’t show any correlation between adiponectin andvarious lipid parameters. Again, this finding suggests that the beneficial effect of metformin on lipid parameters are throughmultiple mechanisms and adiponectin may or may not be responsible for this effect.
Limitation of the Study
The sample size is small and the proportion of visceral and subcutaneous adipose tissue is not measured. Insulin resistance isalso not estimated.
Summary
In conclusion, our study has shown the beneficial effect of metformin treatment on BMI, glycaemic control and improvementin the lipid parameters. There is a significant elevation of adiponectin with metformin treatment, but there is no correlationbetween adiponectin and the above parameters suggesting that these effects are through different mechanisms.
Declaration of conflicting interests
The authors declare no conflict of interest pertaining to this study
Funding
No funds are received for the conduct of study from any agency. The hospital being government-owned, everything is freeand adiponectin was purchased from personal funds.
Ethical approval
Since this study is an observational study, there is no need for ethics committee approval. Approval was obtained from thesuper speciality board committee.
References
1. Liu C, Feng X, Li Q, Wang Y, Li Q, Hua M. Adiponectin, TNF-α and inflammatory cytokines and risk of type 2 diabetes: Asystematic review and meta-analysis. Cytokine. 2016; 86:100-109.
2. Galic S, Oakhill JS, Steinberg GR. Adipose Tissue as an Endocrine Organ. Mol Cell Endocrinol. 2010 25;316(2):129-39.
3. Balsan GA, Vieira JLDC, de Oliveira AM, Portal VL. Relationship between adiponectin, obesity and insulin resistance. RevAssoc Med Bras (1992). 2015; 61(1):72-80.
4. Flier EL. Obesity. In: Melmed S, Koenig R, Rosen C, Auchus R, Goldfine A eds. Williams textbook of endocrinology 14thedition. Elsevier; 2019:1573.
5. Pajvani UB, Scherer PE. Adiponectin: Systemic Contributor to Insulin Sensitivity. Curr Diab Rep. 2003; 3(3):207-13.
6. Guenther M, James R, Marks J, Zhao S, Szabo A, Kidambi S. Adiposity distribution influences circulating adiponectin levels.Transl Res. 2014; 164(4):270-277.
7. Kopp HP, Krzyzanowska K, Möhlig M, Spranger J, Pfeiffer AFH, Schernthaner G. Effects of Marked Weight Loss on PlasmaLevels of Adiponectin, Markers of Chronic Subclinical Inflammation and Insulin Resistance in Morbidly Obese Women. Int JObes (Lond). 2005; 29(7):766-71.
8. Reneau J, Goldblatt M, Gould J, Kindel T, Kastenmeier A, Higgins R, et al. Effect of adiposity on tissue-specific adiponectinsecretion. PLoS ONE 2018; 13(6):e0198889.
9. Ahima RS. Adipose Tissue as an Endocrine Organ. Obesity (Silver Spring). 2006; 14 Suppl 5:242S-249S
10. Abdelgadir M, Karlsson AF, Berglund L, Berne C. Low serum adiponectin concentrations are associated with insulin sensitivityindependent of obesity in Sudanese subjects with type 2 diabetes mellitus. Diabetol Metab Syndr. 2013; 5:15.
11. Snehalatha C, Yamuna A, Ramachandran A. Plasma Adiponectin Does Not Correlate With Insulin Resistance and Cardiometabolic Variables in Nondiabetic Asian Indian Teenagers. Diabetes Care. 2008; 31(12):2374-2379.
12. J-R Su , Z-H Lu , Y Su , N Zhao , C-L Dong , L Sun, et al. Relationship of Serum Adiponectin Levels and Metformin Therapyin Patients With Type 2 Diabetes. Horm Metab Res. 2016; 48(2):92-8.
13. Zulian A, Cancello R, Girola A, Gilardini L, Alberti L, Croci M, et al. In Vitro and in Vivo Effects of Metformin on HumanAdipose Tissue Adiponectin. Obes Facts. 2011; 4(1):27-33.
14. Z Kovacova , M Tencerova, B Roussel, Z Wedellova, L Rossmeislova, D Langin, et al. The Impact of Obesity on Secretion ofAdiponectin Multimeric Isoforms Differs in Visceral and Subcutaneous Adipose Tissue. Int J Obes (Lond). 2012; 36(10):1360-365.
15. Auguet T, Terra X, Hernández M, Sabench F, Porras JA, Orellana-Gavaldà JM, et al. Clinical and Adipocytokine Changes AfterBariatric Surgery in Morbidly Obese Women. Obesity (Silver Spring). 2014; 22(1):188-94.
16. Gil-Campos M, Cañete RR, Gil A. Adiponectin, the Missing Link in Insulin Resistance and Obesity. Clin Nutr. 2004; 23(5):963-74.
